
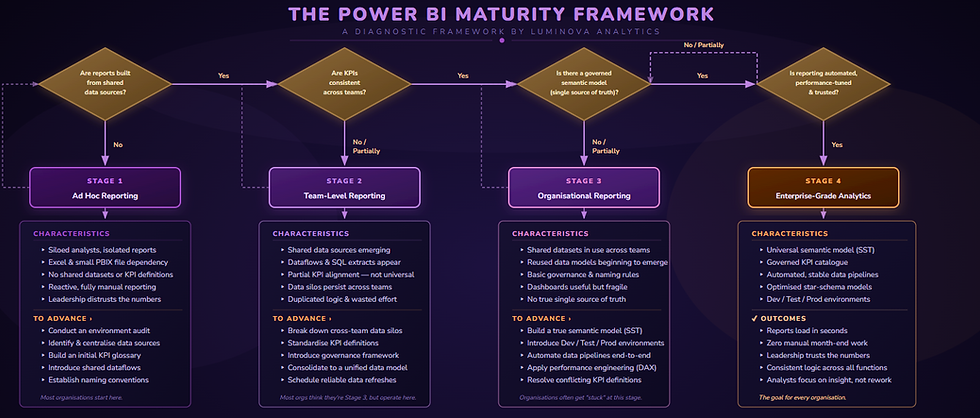
The Power BI Maturity Framework
A diagnostic framework for scaling Power BI from isolated dashboards to enterprise-grade analytics
Why Power BI Maturity Matters
Most organisations don’t struggle with Power BI because of missing features or lack of licences. They struggle because their BI estate hasn’t matured at the same pace as adoption.
When maturity stalls, the symptoms show up across the business, not just in dashboards.
Conflicting KPIs and constant debate
As Power BI is adopted by various teams, conflicting metric versions emerge, leading to debates instead of decisions. Without a unified, governed foundation, it fosters confusion rather than clarity.
Fragile dashboards that don’t scale
Dashboards may perform well at first, but as data increases and usage rises, performance declines. Reports load slowly, refreshes fail, and confidence diminishes, turning what seemed adequate into a fragile solution under real business demands.
Analyst burnout and wasted effort
Analysts are wasting time fixing refresh issues and reconciling numbers for reports, which hampers insight delivery and limits analytics value.
Executive distrust and spreadsheet fallbacks
When leaders can't identify the source of a number or find inconsistent answers, trust erodes. Stakeholders revert to spreadsheets, hindering Power BI adoption and reinforcing manual, error-prone processes.
Scaling pain as adoption increases
Ironically, as Power BI succeeds, its issues worsen. New reports take weeks, month-end is still manual, and changes feel risky. Growth without maturity exacerbates the problem.
No traceability or confidence in the numbers
As reporting grows, a key question arises: what is the source of this number? Without data lineage and logic, even accurate figures become questionable. Analysts struggle to explain calculations, auditors can't track the trail, and stakeholders lose trust. If numbers can't be traced back, confidence diminishes, regardless of dashboard polish.
The Power BI Maturity Framework exists to stop this cycle. It provides a clear way to understand why these symptoms appear, what stage your organisation is operating at today, and how to move from fragile reporting to a trusted, enterprise‑grade analytics platform.
If these signs feel familiar, the issue isn’t Power BI, it’s maturity.
The 4 Maturity Stages
The Power BI Maturity Framework breaks reporting evolution into four clear stages. Each stage reflects how data is structured, governed, trusted, and scaled across the organisation. Progression is not about more dashboards, it is about building a stable, reusable foundation that supports decision‑making as adoption grows.

Stage 1: Ad Hoc Reporting
At Stage 1, reporting exists, but there is no shared foundation behind it. Power BI is typically used by individual analysts or small teams to solve immediate problems.
What this looks like
-
Analysts work in silos, each building their own reports
-
Heavy reliance on Excel and small standalone PBIX files
-
No shared datasets or agreed KPI definitions
-
Reporting is reactive and largely manual
-
Leadership does not fully trust the numbers
The reality
Power BI delivers value in pockets, but every report is effectively rebuilt from scratch. As soon as demand increases, performance, consistency and confidence begin to break down.
To move forward
The focus at this stage is visibility and control: understanding what exists today, centralising core data sources, and establishing basic standards.

Stage 2: Team-Level Reporting
At Stage 2, teams begin to collaborate and reuse data, but alignment stops at departmental boundaries.
What this looks like
-
Shared data sources start to emerge
-
Dataflows and SQL extracts are introduced
-
Partial KPI alignment, but not across the organisation
-
Data silos persist between teams
-
Significant duplication of logic and effort
The reality
This is the most common stage. Dashboards appear more mature, but the estate is fragile. Organisations often believe they are operating at a higher level than they actually are.
To move forward
Progress requires breaking down cross‑team silos, standardising KPIs, and consolidating logic into a unified data model rather than duplicating it across reports.

Stage 3: Organisational Reporting
At Stage 3, Power BI is used across the organisation and begins to support strategic decision‑making, but scalability issues remain.
What this looks like
-
Shared datasets used across multiple teams
-
Reused data models begin to emerge
-
Basic governance and naming conventions are in place
-
Dashboards are useful but fragile
-
No true single source of truth
The reality
This is where many organisations get stuck. Reporting works, until it doesn’t. Performance tuning, deployment discipline, and conflicting definitions become ongoing challenges.
To move forward
The key shift is architectural: establishing a true semantic model as the single source of truth, introducing Dev / Test / Prod environments, and automating pipelines end‑to‑end.

Stage 4: Enterprise‑Grade Analytics
Stage 4 represents a fully mature, enterprise‑ready Power BI estate.
What this looks like
-
A universal semantic model (single source of truth)
-
Governed, organisation‑wide KPI catalogue
-
Automated and stable data pipelines
-
Optimised star‑schema models
-
Dev / Test / Prod environments with controlled deployments
The outcomes
-
Reports load in seconds
-
Zero manual month‑end reporting
-
Leadership trusts the numbers
-
Consistent logic across all functions
-
Analysts focus on insight, not rework
The reality
Power BI becomes a strategic asset. New dashboards are delivered quickly, confidently, and without rebuilding underlying logic.

These stages are not theoretical. Every organisation sits clearly within one of them. The goal of the Power BI Maturity Framework is to identify your current stage and provide a structured, realistic path to the next.
Find Your Power BI Maturity Stage
The fastest way to understand where you sit on the maturity curve is to complete the Power BI Maturity Scorecard - a 12‑question diagnostic aligned directly to this framework.


How Power BI Maturity Actually Advances - 8 structured steps to enterprise maturity
The Luminova Method
Advancing Power BI maturity is not about random fixes, isolated optimisations, or rebuilding dashboards one by one. Those approaches often make things look better short‑term, but they rarely scale.
The Luminova Method treats maturity as a system. Each step builds on the last, creating a stable foundation that allows Power BI to scale confidently as adoption, data volume, and business demand increase.
This is the structured approach we use to move organisations from fragile reporting to enterprise‑grade analytics.

Why Sequence Matters
Many organisations attempt performance tuning before fixing models, or governance before alignment. This creates short‑term improvements but long‑term fragility. The Luminova Method is intentionally sequential. Each step removes constraints that would otherwise limit the next.
Delivered as a structured engagement - Every step builds toward Stage 4
1
Environment Audit
Every engagement begins with clarity. We evaluate your Power BI setup - reports, datasets, data sources, refresh processes, and usage patterns, to identify existing elements, duplication, risks, and valuable components. This baseline is essential for effective improvement efforts.
2
KPI Standardisation
Conflicting KPIs can quickly erode trust in reporting. We collaborate with stakeholders to define, document and agree on core business metrics, creating a shared KPI language that aligns decision-making and supports a governed semantic model.
3
Semantic Model Design
This is the architectural heart of maturity. We create a reusable semantic model as a single source of truth, centralising measures, relationships, and business rules to reduce build time, inconsistencies, and simplify maintenance.
4
Performance Engineering
As usage grows, performance becomes non‑negotiable. We optimize models, DAX, and data structures for quick loading and reliable scaling. Performance engineering is vital for adoption, as fast reports make Power BI a trusted decision-making platform.
5
Dashboard Rebuild
Dashboards are now rebuilt on the new semantic model instead of being patched. Reports are simplified and layouts focus on performance and clarity. The goal is not cosmetic redesign but rather to make dashboards fast, reliable, and aligned with a single source of truth.
6
Governance Framework
Mature Power BI environments avoid tribal knowledge by implementing governance on ownership, certification, workspace structure, and change control. This fosters consistency, traceability, and confidence while maintaining team efficiency.
7
Training & Adoption
Technology only delivers value when people use it correctly. We support analysts and stakeholders with targeted training, best‑practice guidance, and adoption support to establish consistent practices, reduce individual reliance, and maintain long-term maturity.
8
Automation & Optimisation
As maturity grows, manual efforts fade away. Data pipelines become fully automated, deployments are efficiently managed, and reporting is reliable. Continuous optimisation keeps the Power BI environment performing well as the organisation evolves.
The result is a Power BI estate that scales with the organisation - faster reporting, consistent numbers, and analysts focused on insight instead of rework.

Who This Framework Is For
The Power BI Maturity Framework is designed for organisations that have moved beyond experimentation but are struggling to scale reporting in a way that is trusted, efficient, and sustainable.
It is particularly relevant if any of the following situations sound familiar.
Analytics & BI Leaders
You are responsible for the quality, performance, and credibility of reporting across the organisation. Adoption is growing, but so are complaints about speed, inconsistency, and fragility.
You need a clear structure to stabilise the estate, remove duplication, and build a foundation that scales without constantly firefighting issues.
Heads of Finance, Operations & Commercial Teams
You rely on reporting to run the business, but too much time is spent questioning numbers, reconciling figures, or falling back to spreadsheets.
This framework is for leaders who want confidence that the numbers are consistent, traceable, and decision‑ready, especially during critical periods like month‑end.
Organisations Stuck Between Stage 2 and Stage 3
Many organisations believe they are operating at an organisational or enterprise level, but in practice are still constrained by team‑level silos, duplicated logic, and fragile dashboards.
The framework helps identify the real stage you are operating at today and provides a realistic path to move forward without rebuilding everything from scratch.
Growing Organisations Scaling Power BI
If Power BI usage is expanding quickly, the risks multiply just as fast. What worked for a handful of users no longer holds up when dozens, or hundreds, rely on the same reports.
This framework is built for organisations that want to scale Power BI confidently, without slowing delivery or sacrificing trust.
Teams Who Want to Do This Properly
Whether you are modernising an inherited BI estate or deliberately building towards enterprise maturity, the framework provides a clear, proven structure.
It is not about perfection. It is about making the right decisions, in the right order, to avoid future pain.
If you recognise yourself in any of these scenarios, the next step is understanding where you sit on the maturity curve and what to focus on next.

How the Maturity Framework Relates to Our Other Services
As your Power BI estate grows, it's common to need more than one type of support. The Maturity Framework sits at the centre of our service offer, but it's worth understanding how it relates to two services that share similar ground.
Maturity Framework
vs
Modernisation & Consolidation
Both services address the same root causes: fragile data models, inconsistent KPIs, duplicated logic, and reporting that doesn't scale. The difference is scope and intent.
The Modernisation & Consolidation service is a targeted delivery engagement. If specific reports are broken, slow, or untrustworthy, we fix them — rebuilding models, consolidating datasets, and restoring confidence in the numbers. The focus is a defined problem with a clear output.
The Maturity Framework is a strategic engagement. It diagnoses the state of your entire Power BI estate across governance, architecture, adoption, and scalability — then provides a sequenced roadmap to advance. It's not about fixing one report; it's about understanding why the estate became fragile and building the structure to prevent it recurring.
Many organisations use both: Modernisation addresses the immediate pain, while the Maturity Framework provides the longer-term architecture to grow into.
Maturity Framework
vs
Copilot Readiness Assessment
The Copilot Readiness Assessment is specifically focused on whether your Power BI environment is ready for Microsoft Copilot, auditing your semantic models, licensing position, and governance against what Copilot requires to work reliably.
The Maturity Framework is broader. It covers the full health of your Power BI estate, of which Copilot readiness is one dimension. In practice, a well-matured estate is a prerequisite for Copilot to deliver value, organisations at Stage 1 or 2 will struggle to get meaningful results from Copilot regardless of licensing.
If Copilot is your near-term priority, the Readiness Assessment is the right starting point. If you want to understand and advance the overall state of your Power BI estate, with Copilot as one of several goals, the Maturity Framework is the broader engagement.

Which service is right for you?
Modernisation & Consolidation
Maturity Framework
Copilot Readiness Assessment
Specific broken reports or datasets
Estate-wide diagnosis and roadmap
Preparing for Microsoft Copilot
Strategic long-term foundation
Immediate fixes with clear output
Overlapping goals
Explore The Framework In More Detail
For a deeper explanation of how the framework works in practice, including why organisations get stuck at certain stages and what actually enables progression, read our detailed guide:
→ Power BI Maturity Framework: How to Scale to Enterprise‑Level Reporting
This article expands on the thinking behind the framework and provides real‑world context before you move on to assessing your own maturity.


Frequently asked questions
Ready to move your Power BI estate to the next level?

30 min