

Case Study — Power BI Sales Reporting Dashboard
Driving Data-Driven Decisions with Microsoft Fabric
Client Challenge
Many organisations struggle to gain a unified view of sales performance when reporting is fragmented or inconsistent. Reporting is frequently fragmented across spreadsheets, static dashboards, and siloed systems, making it difficult to answer critical questions:
-
How is overall revenue trending?
-
Which products, customers, or regions are driving growth?
-
Where are performance gaps or opportunities for expansion?
Without real-time insights, decision-making can be slow, opportunities are missed, and underperformance is often only noticed after it has impacted results. A modern, interactive solution that consolidates data and provides a clear view of sales performance is increasingly essential for proactive, data-driven management.
Solution
To demonstrate how organisations can overcome these challenges, we built a solution using a sample Microsoft sales dataset, highlighting best practices for interactive sales analytics. The project began with a process-focused approach: understanding what insights would be most valuable to leadership, identifying the metrics critical for tracking performance, and designing a framework to make the data both actionable and easy to explore.
The underlying data model was designed on Microsoft Fabric, leveraging its Lakehouse architecture to provide scalable, centralised storage and analytics. Using a structured query layer with SQL, we created a robust semantic model in Power BI, incorporating fact and dimension tables, hierarchies, and field parameters to allow dynamic metric switching across pages. Direct connectivity ensured near real-time insights, eliminating the delays of manual refresh cycles and fragmented reporting. This architecture underpins how organisations can integrate fragmented sales data into a single source of truth, enabling leadership to explore performance dynamically and confidently.
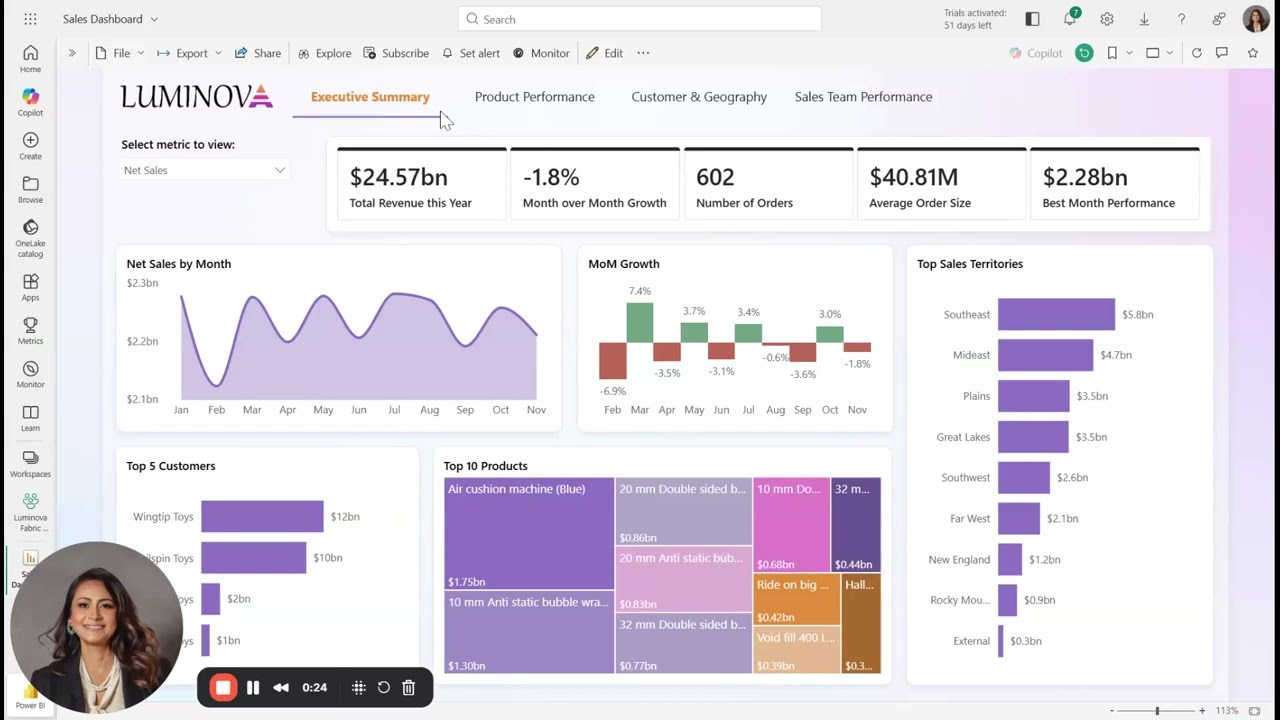
Building on this foundation, we developed a four-page Power BI dashboard to give a complete view of sales performance. The Executive Summary page delivers high-level visibility for leadership, showcasing total revenue, month-over-month growth, number of orders, and average order size. Trend visuals illustrate net sales over time, while top customers, top products, and leading sales territories are clearly highlighted. A field parameter selector allows users to dynamically navigate between different performance metrics without leaving the page.
The Product Performance page provides a deeper look at product-level contribution, displaying revenue, orders, and quantities for top products alongside comparisons of individual product impact on overall sales. Net sales by customer are also included to give insights into product performance across accounts.
On the Customer & Geography page, regional performance is visualised through ribbon charts showing revenue concentration by geography, combined with detailed metrics on customer-level revenue and order size. This enables leaders to quickly identify high-value markets and customer segments.
Finally, the Sales Team Performance page focuses on individual and team-level insights, displaying total revenue, average deal size, and revenue distribution by territory. Comparative visuals allow managers to identify high performers, address underperformance, and optimize resource allocation across regions.
Overall, the solution combines the power of Microsoft Fabric with a flexible, interactive Power BI interface to provide a single source of truth for sales performance. Leadership can now explore data across products, customers, regions, and teams in real time, make informed decisions, and proactively respond to emerging opportunities and risks.
Business Impact
By consolidating sales data into a single, interactive dashboard, organizations can gain a unified view of performance across products, customers, regions, and sales teams. Dynamic metric navigation using field parameters allows users to explore different perspectives quickly, comparing performance by product, territory, or individual salesperson without leaving the dashboard.
Leveraging Microsoft Fabric Lakehouse ensures near real-time insights, enabling faster, more informed decision-making and reducing reliance on fragmented or manually compiled reports. Leadership can identify top-performing products, regions, and team members, improving resource allocation and prioritisation of growth opportunities.
Overall, this solution empowers sales leadership to monitor trends, optimise strategies, and respond proactively to emerging challenges. Even in a hypothetical scenario, the dashboard demonstrates how organisations can turn complex, multi-dimensional data into actionable insights, driving smarter decision-making and supporting sustainable business growth.